The Data Shows That Hillary Lost Because of Emails, and That Fact is Critical to Understanding America

Politics Features Hillary Clinton
The Data Shows That Hillary Lost Because of Emails, and That Fact is Critical to Understanding America

On Election Day I submitted a pitch to my editor here at Paste. He wisely rejected it. Here it is in full. Get your kicks in:

Nate Silver shows us two things today: Clinton will win in an electoral landslide, and undecided voters are maniacs.

Silver didn’t say it, but his sure numbers do — which speak for him. Check out fivethirtyeight’s percentages in every critical state — OH, FL, NC, PA, wherever. All tell the same story: Comey pulls dunce move, her trends plummet. Then the FBI does the right thing Sunday and suddenly she’s back up. I wonder why.

And today — decision time — these trends might increase exponentially at the polls. Not only will she win, she might destroy Trump.

These trends illustrate that the election, which so many classified as a referendum on Trump, was in its final weeks — on the heels of the pussy tape and revelations of sexual assault! — all about Clinton. The email “scandal” — resolved in July — outweighed all of that.

Undecided voters are complete maniacs.

Whoops.

Everyone says they know why Hillary Clinton lost. The polls were wrong. Liberals were arrogant and didn’t reach out to white voters. There were more silent white Trump supporters than we thought. Republicans came home. If the dems had turned out, Clinton would have won in a landslide. We shoulda nominated Bernie. Yeah, Bernie woulda won, man.

These aren’t exactly wrong. But these if onlys and counterfactuals (Bernie!) drive me nuts and are, in my opinion, useless. We’ll never know. You can make a solid case for Bernie, but there was clearly also a solid case for Clinton. You can make a solid case against Clinton, but you can also make a solid case against Bernie. Hindsight is just a form of nostalgia. Let’s move on, yeah?

If you’re like me, you’re sick of election analysis. Everyone’s a pundit, everyone’s an armchair quarterback. And it’s particularly off-putting that I’m defending myself, because I was so wildly wrong. I don’t blame you for making fun of me or dismissing me outright or not reading further. But:

I don’t think I was wrong. I mean, I was obviously wrong about the results. But I spent a lot of time after the election looking back at those graphs. I knew there was something to them, the trends were so uniform. Turns out I’m just a dipshit who doesn’t know how to read data. The data I arrogantly — okay, rudely — cited didn’t say Clinton was going to win. They said she was going to lose.

Why? Trends are better predictors than numbers, and the trends said that the election had almost nothing to do with Donald Trump — a bigoted, misogynistic, self-righteous, sexually predatory, maniacal con man who understands dangerously little about the political world.

No: It was all about Clinton. And when you really break it down? It was about the goddamn emails.

What’s more, the reason Clinton lost isn’t academic. It’s not hindsight, and it’s not the obvious and simplistic “people hate Clinton.” My point here is a little different: If you thought this election was going to be decided by how people felt about Donald Trump’s behavior and inanity and offensiveness and ignorance at any point, you were wrong. We were wrong. That is how far off the American moral compass is. And that is gross.

Let’s check it out.

First, the polls weren’t that far off: The numbers were always fairly close, and Trump was almost always within the margin of error. Plus, Clinton won the popular vote — she just lost in valuable places.

But I’m not looking at poll numbers. I’m concerned with the story here — the “why” — and even if we had reliable numbers, they alone wouldn’t tell a story.

But trends do. They show us when voters changed their minds. We can check that against events and see which events were most powerful and deduce why.

So if you’ll indulge me, let’s compare graphs on 538 together. (I’m aware this is one outlet, and I’m aware they were wrong, and I’m aware of the analytical criticisms. But read this. Also, though 538 picked Clinton, they did give Trump much better chances than most — 28 percent. Even the betting markets only gave Trump an 18 percent chance of winning.)

The inflection points that indicate trendshifts on these graphs synch up nearly exactly — across states as well as when cross-checking state trends with national trends. We’ll match the big trendshifts with the news on and around those dates. You’ll see the trends lock right up with the big stories.

Okay, so what was in the news?

Let’s look at the numbers before there was any real news. Bad news: We can’t print the graphs here, but I’ll link to all of them as I go.

First we’ll check out the graphs of the national popular vote and electoral vote. (Toggle between popular vote and electoral vote in the bar just above the graph.) Find the Clinton peak before any news broke. Popular vote: Clinton peaked at 49.2 percent. Electoral, just over 353 votes.

Before there was any news, it’s obvious Clinton had a comfortable and steady lead. Steadily trending up, too. Then about halfway through July, something happened. Any guesses?

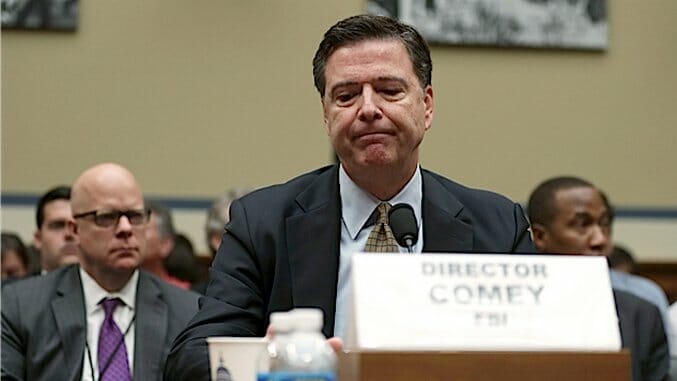
Move the cursor to July 12. That’s when we got the first polls back after Comey’s press conference condemning but exonerating Clinton’s use of a private server as Secretary of State to send and store government emails, some of which contained classified information.

Again: She was exonerated.

And what happens? Clinton plummets through July. No matter what Comey said, people believed the worst. He exonerated her, used harsh language, and she dropped. A tip of the hat to the alt-right press on that one.

And just for fun, check out what happens to Clinton’s “chances of winning” in Wisconsin after July 12. (Note: “Chances of winning” graphs synch up with polls but because they swing more wildly they can better illustrate shifts. Even California, which shows nearly no statistical change throughout the election, has an obvious drop after July 12.)

Moving on, Clinton’s downward trend reverses at the end of July and into early August. In the news then? The Democratic National Convention, and specifically Trump’s deplorable reaction to Khizr Khan’s speech.

And what happens? Clinton gets a huge bump! She surges… right back to where she was in the first place. With a little perspective, that “huge bump” we saw (and talked about) basically just dug her out of the email hole. Again, go to the national popular vote and follow Clinton’s upward trend to its peak.

Her post-Khan peak? 49.9 percent. Compare that with her peak before the emails — she’d hit 49.2 percent before that story broke. This means that after Khan — Trump’s moral rock bottom (at the time) — Clinton only pulls statistically even with where she was before Comey made his campaign 2016 debut.

No matter what Trump did, Clinton couldn’t crack that ceiling.

Then we see the nation forgets about Trump and slowly remembers, “Oh yeah, she’s a crook.” No news, no big shifts, no points to nail down. Just the gradual drool of undecided voters.

But then, and perhaps most depressing of all, we come to the next identifiable trendshift point: September 11. Yes. September 11.

Pneumonia.

Again, the swing here is best illustrated on “chances of winning” graphs. You can check all of them yourself, of course, they nearly all line up. But for fun, here are a few of those vomit-inducing graphs. North Carolina, Florida, and Ohio. Move your cursor to Sept. 11 and then ease it forward. In all three states there was not only a trendshift but a lead swap as a result of Clinton getting pneumonia.

The national popular vote also shows us Clinton’s polls bottom out after September 11 (at 46.4 percent). Her lowest point in July, after Comey’s press conference, was 46.1 percent — a statistical tie.

What’s more? Move your cursor along that trend, all the way to Election Day. She never again dips below 46.4 percent of the popular vote. Her low point? Pneumonia.

(Remember: these are trends, not numbers. Think in terms of lows and highs, not raw numbers.)

Okay, next: Check September 26ish. Another referendum on Clinton, not on Trump. Clinton crushed Trump in the first debate, proved herself highly competent, and she trends up. But again, she gets nowhere near her high points.

Then… the Pussy Tapes.

Huge bump, right? Referendum on Trump, right? No: After those tapes came out Clinton only led by four points (outlier polls had her higher, but the trends don’t match that). Plus she was already trending up after the first debate, and that “huge bump” from the tapes didn’t put her anywhere near her numbers before July 12, anyway.

Again: Trump talked about sexually assaulting women. Didn’t matter.

We can also compare Clinton’s post-pussy high in October with her earlier peaks in national polls. When we do that, we see that, at the same time Trump is melting down and insulting women on Twitter at 3 a.m. and talking about suing the many women who said he’d assaulted them — in the middle of all of that, Clinton’s bumps are actually getting weaker.

Given: A great deal of voters never liked Hillary and never would. We’ll not get into the reasons here, but that was obvious from the start. But a great deal of voters never liked Trump, either. His numbers seem to fall only when he does something egregious — Khan — but Clinton’s fall after some bullshit “story” such as pneumonia or emails.

What to make of that? Clinton’s perceived faults mattered far more to the undecided American voter than those of Donald J. Trump.

Because look at the next shift. On Oct. 28 Comey sent a letter to Congress informing them the FBI had discovered “new” emails in the Clinton case. The FBI was going to check them to see if they had classified information.

Pick a graph, any graph. Okay, here are a few important ones.

Pennsylvania
Ohio
Michigan
Wisconsin
North Carolina

This election is a referendum on Clinton’s email non-story.

To prove it, look at all those graphs above and check out the positive shift she gets from the email story. On the Sunday before the election Comey cleared the air, and across the board — by every single measure — Clinton bumps up. And that’s exactly why I picked her to win: I thought this shift would increase exponentially when voters faced the levers on Election Day.

Then the dem base didn’t turn out like it did in 2012. Combine that with the targeted suppression efforts on the right and it was just enough to cost her.

But it’s irrefutable: These trends are maps of how much people hated or wanted to hate Clinton. Her leads and her eventual loss had almost nothing to do with Donald Trump — nothing to do with the most flawed, inexperienced, and dangerous major-party candidate in memory. A demagogue, a bigot, a misogynist, a thin-skinned bully, and arguably a fascist.

That’s not to say people didn’t have a reason for voting Trump, the most common reason being the poor persecuted white man narrative of being sick of government leaving them behind and wanting a change. To them, Trump was the outsider who could “shake things up.” That’s an accurate read. Trump, however, is not an outsider candidate. He is a con man and will be beaten by the system. More on that to come.

But more importantly, those voters didn’t decide the election. For the undecided voters, the ones who tipped the scales, Comey’s Oct. 28 blunder confirmed for them Pandora’s lie that Clinton was a crook and couldn’t be trusted. The 9/11 drop, though… that’s just gross.

Turns out I was only half wrong: Hillary lost, and undecided voters are maniacs.

0 Comments
Inline Feedbacks
View all comments
Share Tweet Submit Pin